
Histogram widget#
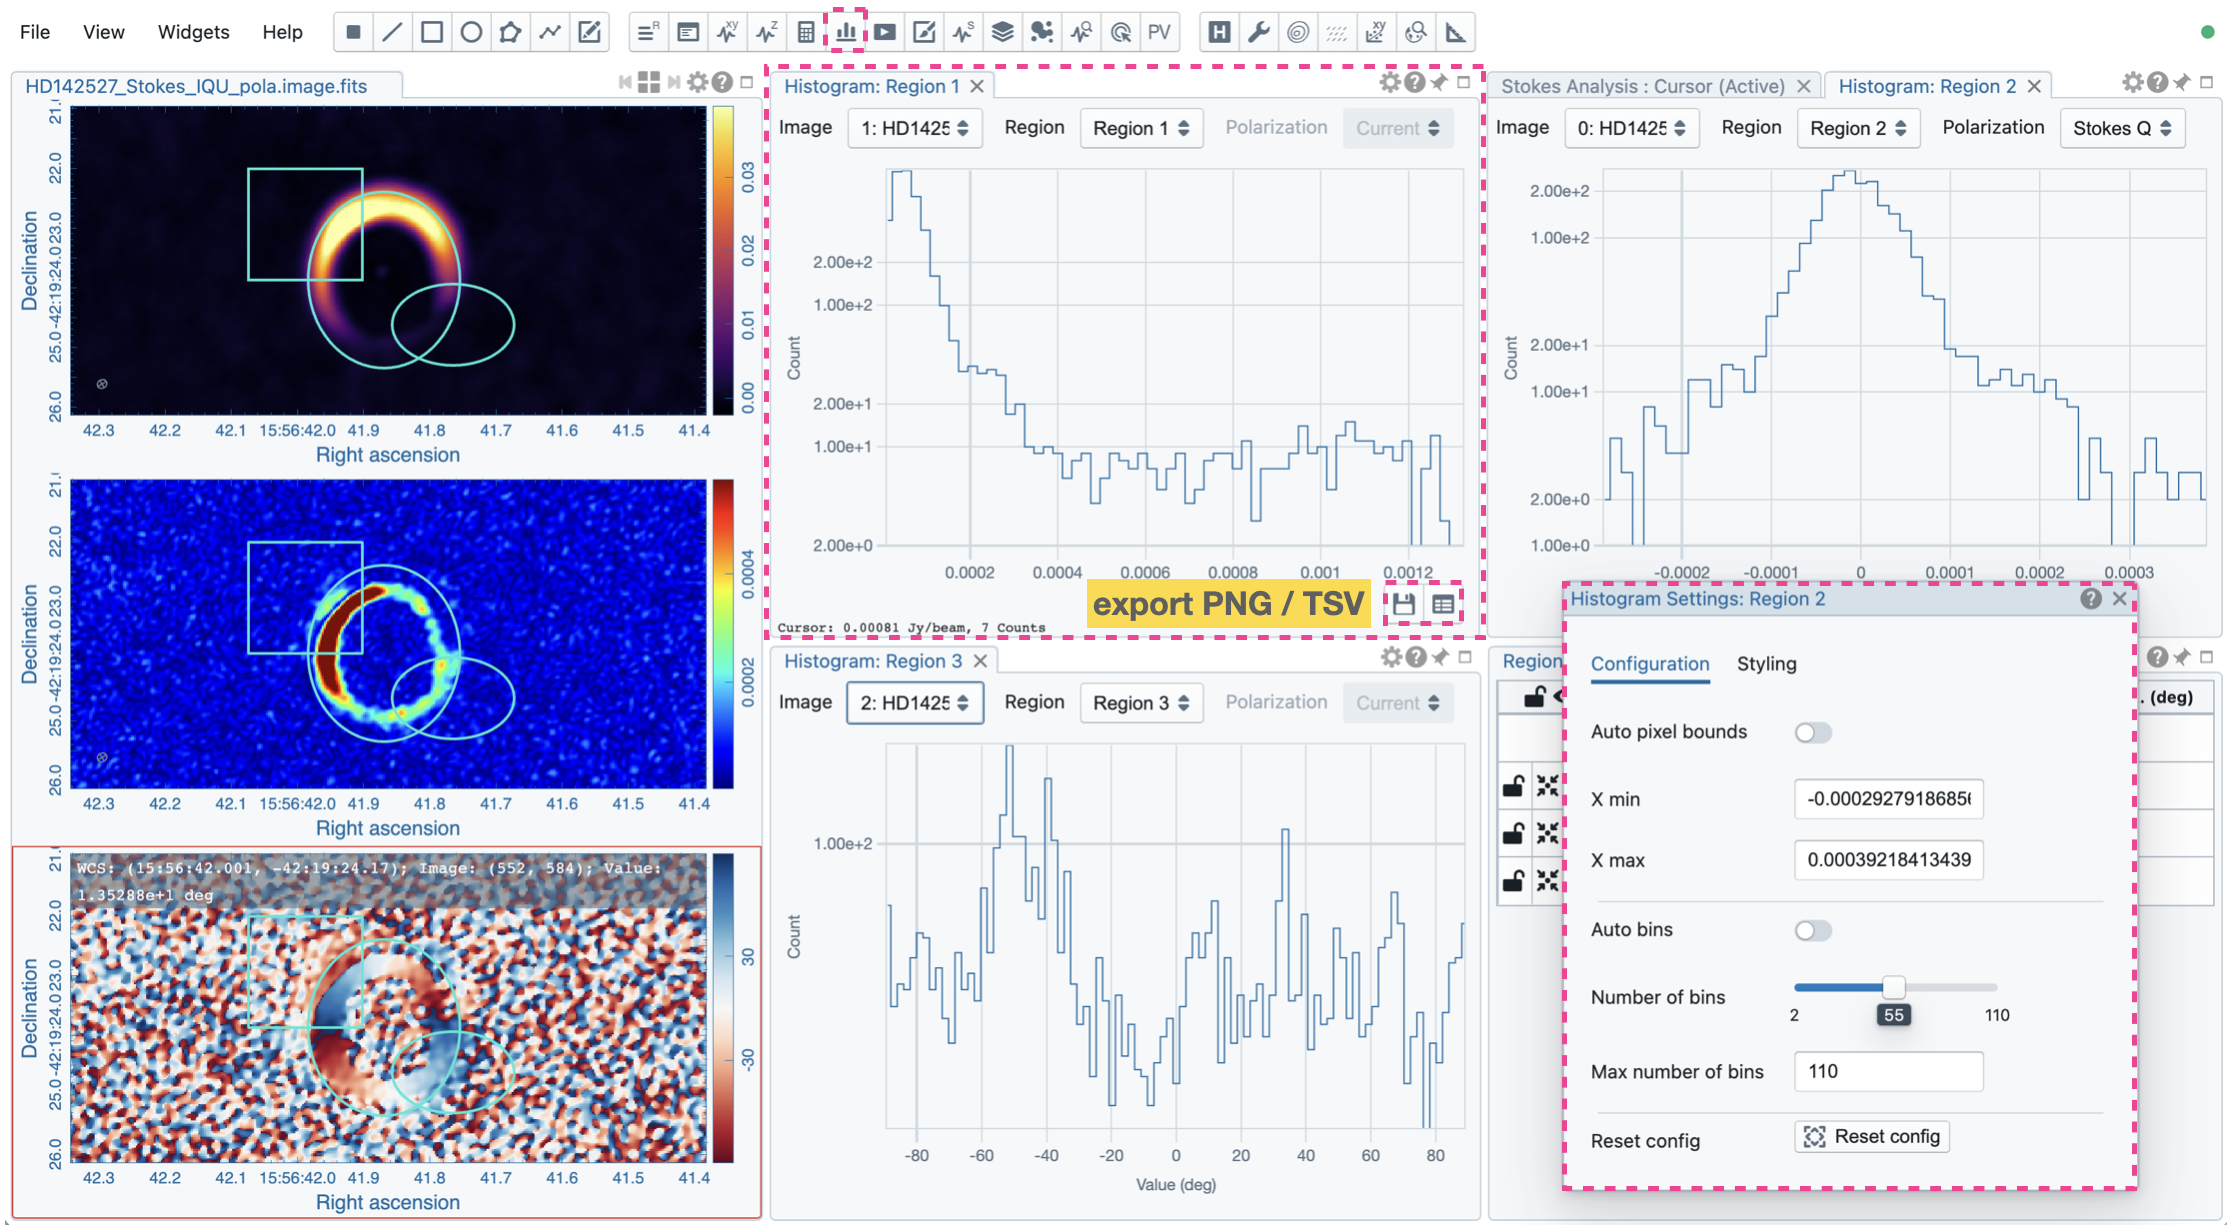
The Histogram Widget allows you to visualize image data as a histogram. The “Image” dropdown menu and the “Region” dropdown menu can select which region from which image to display. When the selected image has the polarization axis, you can use the “Polarization” dropdown menu to select a target polarization component to compute a histogram. The default is “Active”, which means the active (selected) region and the active image in the Image Viewer. The “Active” option refers to the entire image if no region is active. Multiple Histogram Widgets can be created to display histograms computed with a combination of “Image”, “Region”, and “Polarization” (if it is available).
Note
Histogram fitting functions will be added in a future release.
Interactivity#
The histogram plot can be zoomed and panned with a mouse, similar to the Spatial Profiler Widget or the Spectral Profiler Widget (see Chart interactions).
Computation#
The paramters for the histogram computation can be configured with the “Configuration” tab in the Historgram Settings Dialog which is accessible with te “cog” button at the top-right corner of the Histogram Widget. By default, the lower and upper limits are computed automatically based on the image data (min and max within the region) and the number of bins is also computed automatically (geometric mean of the region size). You can also set the lower and upper limits manually, and set the number of bins to a fixed value by toggling off “Auto pixel bounds” and “Auto bins” and using the extra control elements that appear in the dialog.

Styling#
The appearance of the histogram plot can be customized with the “Styling” tab in the Histogram Settings Dialog.

Export#
With the toolbar at the bottom-right of the Histogram Widget, you can export the plot as a PNG file or as a TSV text file.
Settings#
The Settings Dialog contains the following tabs:
Configuration: Configure the histogram computation parameters (see Computation).
Styling: Configure the appearance of the histogram plot (see Styling).